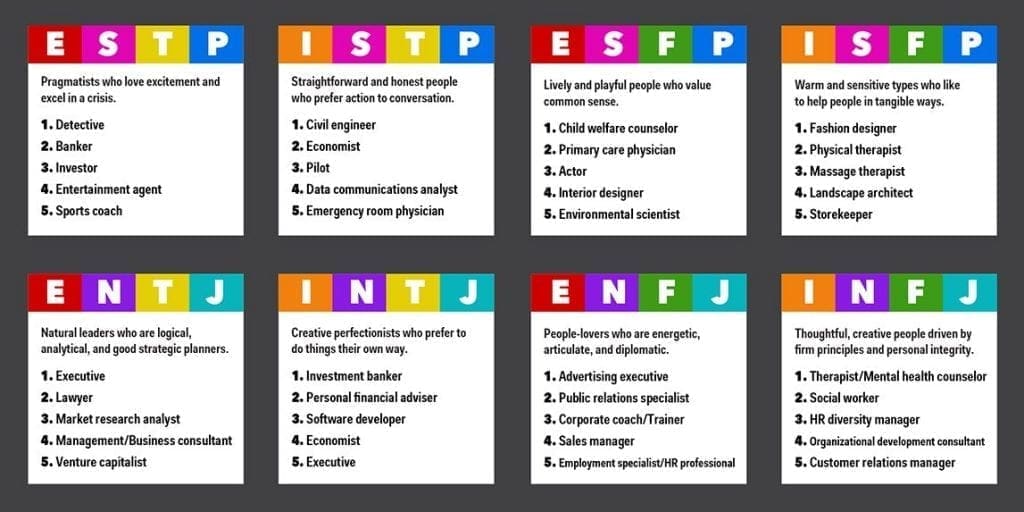
Infographics: the preferred marketing visual tool

Infographics have swiftly evolved as the hot, new internet marketing trend and are rapidly taking over the digital landscape. Infographic act as great pieces of content marketing. They can convey dry statistics in a more compelling and persuasive manner, they are super-shareable and can help readers visualize data and relationships.
Infographics are all over the place these days. You’ll find them on your Twitter feed, Facebook pages and even blogs are publishing new Infographic with their content to generate interest. To help you determine if Infographics are worth your time, here is a brief list of the pros and the cons of Infographic Design.

Pros of Infographic
1. It transforms complex information into visual graphics that are easy to understand.
The attention span of people online is extremely short. You might have impressive content, but the average person isn’t likely to take much time to thoroughly read it. Infographic can make it much easier to access the key points being made in a way that is simple to understand.
2. The information is easier to retain.
Infographic transforms key information points into visual memories, which helps the average person remember most of the information they’ve seen. Other information formats retain fewer data.
3. They catch the eye of the reader.
Infographic creates a genuine topic statement which readers could use to assess if there is value in continuing to read the content. And, if the reader is short on time, they can review the infographic and feel like they got what they needed from their time with your content.
4. It is easy to share Infographic.
With just a click you could pin an infographic to a Pinterest board or share it on Facebook. Save the image and you can tweet it or upload it to your blog. This increases the value proposition being offered to your readers can easily show their followers the worth of what you’ve offered, which then broadens your potential outreach.
Cons of Infographic
1. They can take a lot of time and effort to prepare.
It can be very challenging to create an infographic. You need to design a layout that will be simple to read, include graphics that correspond with the data and craft a story all through the infographic to make it a worthwhile experience.
2. Search engines don’t usually recognize the value of an infographic.
Many Infographics are still perceived as digital image only. What this means is that the true SEO value of the information included on the graphic is not considered for search results. For this reason, a lot of sites are putting up text content along with Infographic so they can rank highly on search engine results instead of waiting for the inbound links to develop naturally.
3. The information on an infographic can still be misinterpreted.
Since there is minimal space for comprehensive information, a lot of people will never get the whole story you want to present through the visual graphic.
4. Many Infographics are difficult to read online as they try to pack in plenty of information.
The image could be so small due to its length and you need to zoom in to read the content. If people see text that is too small to read, they might simply throw in the towel and go somewhere else to look for the information they need.
5. It can still cause a data overload.
A number of Infographic look like a huge blog post, but just in another format. Others have a lot of statistics and figures that it would cause a rocket scientist to understand what the data actually means.


Responses